Example
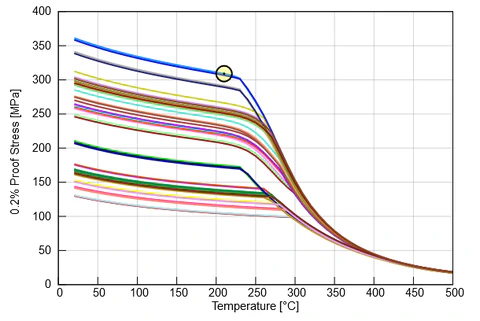
Overlaying curves for the high-temperature strength of different AlSi cast alloys
JMatPro is increasingly used in research and industry for calculation of materials properties. JMatPro calculations result in a physically consistent dataset for a specific chemical composition. Technical alloys show a certain bandwidth of chemical compositions – many calculations are therefore necessary to cover the related bandwidth of properties.
EDA helps you to analyze big volumes of data from JMatPro calculations. ICME (Integrated Computational Materials Engineering) with EDA and JMatPro is successfully used in many practical projects.
made easy with JMatPro and EDA
Typically JMatPro is used by a few employees in the company. However, the data from JMatPro are beneficial for a variety of engineers in their daily work for the design of products and processes. EDA helps distribute the right information to relevant employees. Thus, for example, calculated material data sheets can be provided for all relevant materials - and users benefit from the unique consistency and comparability of the data, which is not given in classical databases and catalogs from standards.
The data from JMatPro can also be customized in EDA, e.g. by hiding information using permission control or by defining specific views on the data.
Of course, the web-based EDA system can be seamlessly integrated into the IT infrastructure. Scalability ranges from standalone application through a Matplus-powered cloud solution on the Internet to integration as an “on-premise” solution with interfaces, e.g. to Teamcenter PLM.
*(Integrated Computational Materials Engineeering)
Not all material data result from JMatPro. In practice, prices, availability, product forms and experience as well as test data are important. EDA allows the supplementation of the calculated material data with additional information. An example is the automatic estimation of the alloy surcharge from the chemical composition and configurable price lists for the alloying elements. Further data can be added easily, for example via Copy & Paste. A comparison of test data with calculated material characteristics is also easily possible.
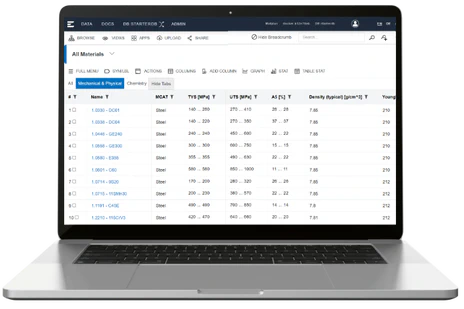
Classic catalogs and datasheets are today often available as PDF-files, comparison of data is awkward. Users of JMatPro are missing the capability to compare data from different calculations. EDA was designed to store the complex data from JMatPro in a powerful database and make them available in a web-browser. This also includes unit conversions and permission control.
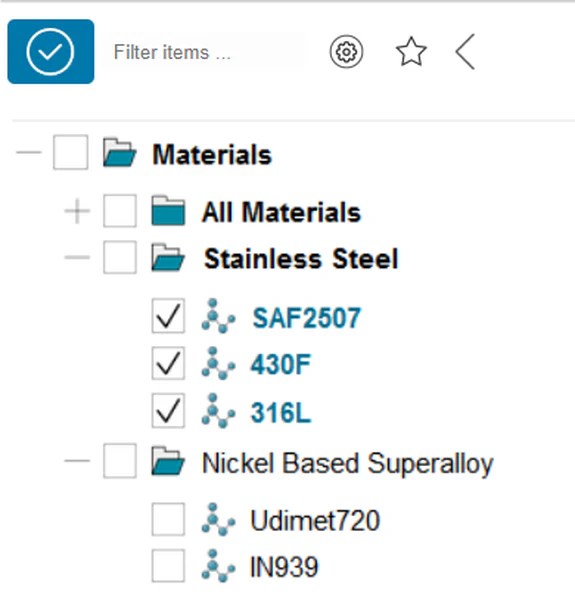
Easy comparison of material records by multiple select using the content tree within the web-browser

Overlaying curves for the high-temperature strength of different AlSi cast alloys
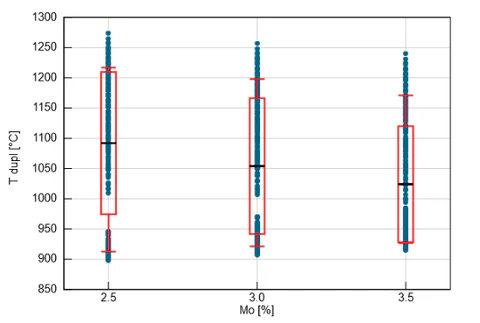
Interactive graphic (statistical box plot) in EDA: Influence of the Mo content on the duplex temperature with 1000 different material variants.
A flexible tree structure is only one entry point to locate materials. Multiple selection of materials shows all data of the marked materials in parallel – Curves are automatically superimposed. In addition, configurable summary tables are available that work with their filter functions like common spreadsheets. Of course, the tables can also be graphically evaluated, e.g. through X-Y plots or histograms.
When choosing materials, there are often conflicting goals: For example, high strength, excellent processing properties and a low price are often required at the same time. This not only applies when deciding on the use of different materials - even a single material designation offers a great deal of optimization potential within the scope of the often broad range of specifications.
EDA facilitates and supports the calculation of material variants with JMatPro. In our own material innovation projects we usually calculate several thousand material modifications. This saves much time and efforts in practical tests and experiments.
EDA offers a built-in tool to automatically generate JMatPro batch files which represent a full factorial record of chemical compositions. JMatPro is then used to generate data which are imported into EDA.
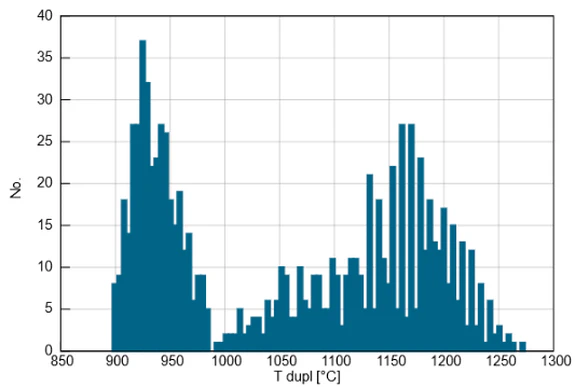
Interactive graphic (histogram) in EDA: Histogram on the duplex temperature for 1000 different material variants.
Interactive Trade-off plots in EDA allow the comparison of large amounts of data. In X-Y diagrams certain properties of the individual variants are compared, for example: strength to alloying costs for 1000 material variants. Target areas in this representation can now be marked graphically and transferred in selection sets. Any number of conflicting Trade-off plots can be created, e.g. for production-relevant information such as conversion kinetics and heat treatment temperatures. The different target conflict representations can then be combined via common selection sets. Selection sets can be visualized in trade-off plots so that global optima can be identified.
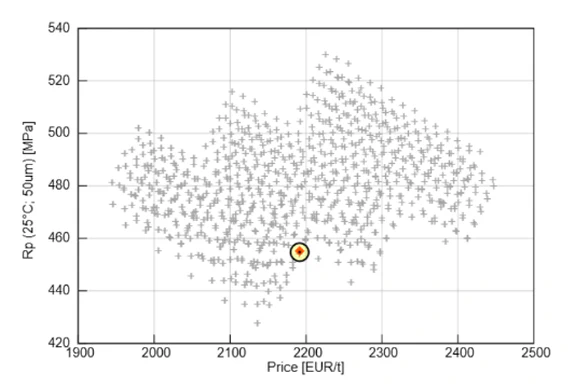
Graphical comparison of 1000 variants of a duplex steel in terms of cost and strength